
The Ansoff Matrix, also known as the Ansoff product/market Growth Matrix, is a strategic planning tool used to analyze and generate four alternative directions for the strategic development of a business or corporation. In a nutshell, it helps executives, managers, and marketers with business management by analyzing strategic options for further growth while considering the potential risk of each option.
What’s the Ansoff Matrix?
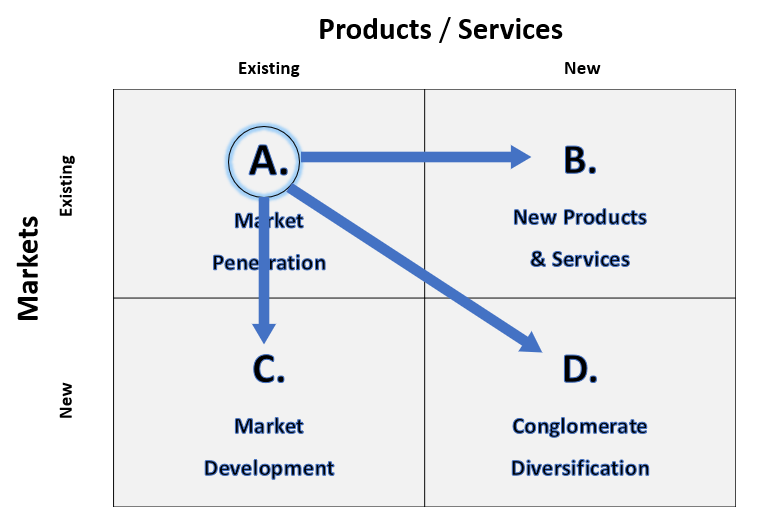
The Ansoff Matrix was named after Igor Ansoff (1957) after it was published in the Harvard Business Review with an essay named “Strategies for Diversification”. Essentially, it breaks down growth options in relation to new products and markets, as well as existing products and markets. Ultimately, it provides the following options:
- Market Penetration
- Product Development
- Market Development
- Diversification

How to use Ansoff Matrix
As mentioned above, the Ansoff Matrix is used by decision-makers to essentially manage the scope of the corporation’s portfolio. Managers and executives need to decide which of the possible four strategies is more beneficial and potentially less risky for their business or corporation.
A bit about Tallyfy
Are you looking to automate tasks between co-workers or clients? You've found the right app for that! With Tallyfy - you can automate tasks and business processes - within minutes.
Let's resume the rest of this article!
Since the market is one of the two variables that comprise the Ansoff Matrix, the tool has been commonly defined as a marketing planning tool. However, it is mainly used on a corporate strategy level, rather than within the marketing department of a business. That’s because growth decisions have a long-term impact on the whole corporation and require an all-encompassing analysis of the corporation’s portfolio scope before being taken.
Benefits of the Ansoff Matrix
- Easy to design – It is literally a 2×2 matrix with 2 variables on the X-axis (Existing & New products) and 2 variables on the Y-axis (Existing & New Markets). The order of the variables is irrelevant.
- Works as a visual communication tool – It makes it easier for the decision-maker to visualize his/her company’s current place. From there, he/she can trivially map the direction to take. Onboarding your existing suppliers, clients, or employees on newly-made corporate level decisions requires very little time since the matrix itself is self-explanatory (a photo is worth a thousand words)
- Helps in forecasting potential risk – the matrix allows a decision maker to calculate potential risk before moving from one quadrant of the matrix to the other
What is Tallyfy?
Tallyfy helps you document and automate tasks between co-workers and clients
Click here to learn about TallyfyManaging Scope of the Corporation Portfolio
As mentioned above, there are 4 different growth strategies that a corporation can select from.
Market Penetration
The first top-left quadrant (A), is generally the starting point for most corporations that are starting to revise their strategic direction. It is by far the most obvious strategic direction for a company because it tries to gain market share by building on its existing markets with its existing product range.
Since it builds on the organization’s existing strategic capabilities, it does not require the company to venture into unexplored markets and products. As a result, it provides a lower amount of risk because essentially the organization’s scope remains unchanged.
Despite this being a relatively safe approach, it faces several potential concerns:
Retaliation from competitors
Increasing existing market share by focusing on market penetration will likely increase rivalry within the industry. With competition getting fiercer on the same range of products, problematic situations such as price wars or expensive marketing campaigns can arise. This is likely to increase the cost and efforts for penetrating the market. In most cases of market penetration, only the companies that possess a clear competitive advantage are able to grow their market share.
Usually, the competitive advantage being inimitable. When facing fierce competition, it might be easier all together to acquire most of the struggling competitors and consolidate all of them within one company. This way you can move rapidly towards gaining the largest market share in your industry.
Economic constraints
Sometimes it is simply not the right time to focus all marketing efforts on penetrating an existing market. If the market is bearish, i.e: the market is experiencing a downturn and a severe decline in stock prices, then it is better to “play dead”. Instead of spending resources on penetrating the market, it can be far more beneficial to diversify the organization’s scope. When such a thing happens, you would be moving from Quadrant A of the Ansoff Matrix to any of the Quadrant B, C, or D.
Legal Constraints
Deciding to penetrate a market further implies the end goal of gaining the largest market share within that specific industry. In most countries, however, there are regulators who try to keep under control organizations that gain excessive market power. Most constraints try to delimit and restrain mergers or acquisitions that can greatly increase an organization’s power.
When it comes to market penetration, there are two general ways to go about it:
- Retrenchment Strategy – the business withdraws its efforts from marginal activities. It then focuses all of its efforts on the most beneficial and valuable services and products it has. This strategy requires a proactive approach to a deep analysis of the company’s strategic capabilities.
- Consolidation Strategy – as the name suggests, the corporation continues doing what it has been doing. Thus consolidating its efforts on the existing products and services. This is regarded as a defensive strategy.
Product Development
Product development in the Ansoff Matrix is the approach in which organizations deliver either new products or modified products in existing markets.
In marketing, this is also referred to as product line extension. Usually, it involves higher risk because it contains varying degrees of diversification. When creating new products, some companies use the same core technology. This lowers the risk arising from developing completely new technologies.
A typical example would be Apple’s core operating system. Apple started growing with the release of the iPod in October 2001. Apple then moved on to producing the iPhone, the iPad, the iWatch and so on…
The core technology used behind each of the products produced by Apple is essentially the same one. They took the same operating system (continuously updated of course) and used it to create new products while targeting the same market. Certainly, the products created by Apple serve different purposes. As such, they require great efforts from their Research and Development Unit.
Possible Risks
So what are the possible risks accompanying the product development strategy of the Ansoff Matrix?
- Involves varying degrees of diversification – when developing new products, corporations end up diversifying not only in the technologies needed for supporting the product development but also in new research facilities, tools, employees and so on… Simply stated, if a firm diversifies its production line, it also needs to diversify throughout all the components that help in producing that line.
- New strategic capabilities – most of the time, new product development requires heavy investment in new technologies. Not in every case can a company use existing technologies to develop new products like in the case of Apple.Practical ExampleEven when considering Apple’s example, each new consecutive product has brought new and innovative technologies into the hands of the customers. The core/base technology was used simply as a stepping stone for creating and mastering new technologies. As a result, product development generally involves heavy investments which are accompanied by an increased risk of project failures.
- Project Management Risk – It goes without saying that when delving into unknown domains, delays and increased costs should be anticipated.
Additionally, Musk pushed back several times his initial goal of building 5000 Model 3 sedans per week by the end of June 2018. Most of these delays are being caused due to unexpected problems in building the new batteries for the car. The new lithium batteries require different ways of manufacturing and because of several bottlenecks, the company has not been able to deliver the components on time.
Market Development
Market Development, as a strategic option of the Ansoff Matrix, provides an alternative to risky and expensive Product Development strategies. It works by offering the organization’s existing products and services in completely new markets.
In most cases, market development requires an effort in product planning and development as well. They go hand-in-hand. If a company is extending its geographic reach and starts targeting European markets in addition to the US market, then the products might need to go through several alterations. At the very least, the product’s packaging will need to be different. The languages used to describe the nutritional information of the product will be different from the English packages. Additionally, the way it is branded might be different due to trends and differences that might have been discovered between European and American populations.
The strategy itself can comprise one or more of the following forms:
- New users – Sometimes some products that were constantly used within one industry, find a better use in a different industry. One typical example would be Listerine. Listerine was first marketed as a floor cleaner. Only when the company decided to brand it as a cure for bad breath, the company’s revenues rose from roughly $115K to about $8 million in a 7-year time frame. Listerine’s target group shifted from cleaning companies, cleaning ladies, and housewives, to literally anyone in the world that wants to maintain a fresh breath. Similarly to Listerine, there are plenty more examples throughout history that prove that the targeting of new users can be a successful strategic decision.
- New geographies – the most typical example of market development by targeting new geographical areas is that of internationalization. When a company goes global, it can target new markets and as a result new users. That’s why the two forms (new geographies & new users) are sometimes mentioned or represented together. However, market development through internationalization is not the only way. A small retail store can expand in different parts of the town or in different cities, thus targeting a larger geographical area.
The problems and risks mentioned in the Product Development quadrant of the Ansoff Matrix can arise in a Market Development strategy as well. Several business planning tools can help you analyze the market before entering it. Two of the most common tools used for analyzing the environment are the PESTEL analysis and Porter’s Five Forces.
- It is difficult to predict the exact resources needed and the outputs when creating a new product. Similarly, when marketing existing products in a new market, market developers might lack the required knowledge and skills for making the necessary progress in a market with unfamiliar users.
- Coordination and management of different activities become difficult because of the need to supply new users, geographies, and segments. However, this falls mainly within the international market development domain.
Diversification
Diversification is by far the riskiest strategic option of the Ansoff Matrix. It is a strategy that radically shifts the scope of the organization by entering completely new markets with completely new products.
Surely, diversification exists in almost every quadrant of the Ansoff Matrix. Even when entering new markets or when creating new products, an organization goes through some type of diversification. However, the Ansoff Matrix clearly helps us visualize the extent to which a company has to diversify when moving away from its existing products and markets.
To be more specific, moving from Quadrant A (Market Penetration) to Quadrant B or C requires less effort on the company’s side then moving directly to Quadrant D (Diversification).
Diversification Drivers
When taking up such a radical strategy (within the Ansoff Matrix), there can be several reasons:
Economies of scope
Several organizations have existing resources and capabilities that they sometimes leave unused or do not use them to their maximal potential. Those capabilities can be applied to different activities, thus creating what is called ‘economies of scope’. The resources and capabilities are used by diversifying them into new activities.
As a result, most universities end up using their facilities for conferences, summer camps and so on. An even better example would be that of AWS. Amazon already possessed server facilities with great computing power. Most of it, they were not using on a continuous basis. As a result, Amazon decided to offer cloud services to users all over the world.
Stretching Corporate Management Competencies
This factor builds upon the economies of scale concept described above. However, instead of considering the employment of existing resources into new markets and product segments, we consider the managerial parental capabilities.
In a nutshell, the managers that are driving business decisions throughout the whole business chain gain valuable experience and knowledge. They can then apply this experience and knowledge to areas of expertise which are not directly related to the organization’s direct services and products.
- Cross-subsidization – having a great and diverse range of businesses can allow the business to greatly increase its market power. Most diversified organizations can allow themselves to cross-subsidize one business or more businesses from more stagnant and profitable ones (usually cash cows). This way, a business can gain a great competitive advantage which can be used to drive competitors away. Most cases in which a business subsidizes another one, with the clear possibility of driving competitors away, it faces strict regulations.
- Mutual forbearance – You can divide this into two core indicating factors:
- Spreading risk – Many companies diversify the core businesses they manage in order to spread the risk among different industries. However, it’s in the shareholder’s best interest to invest in businesses that focus on a very specific industry. Since most investors will usually diversify their portfolio by themselves and don’t actually require a business to be diversified. On the other hand, for private businesses, it’s better to diversify risk across several activities so that one can pull the other in a bearish situation.
- Responding to market decline – If a market or industry becomes saturated or responds slowly to marketing efforts, businesses may decide to diversify into other industries or activities.
- Pressure from strong shareholders – Sometimes shareholders, if they become too strong, can directly influence the direction of the company. This is something to be very careful of. Pressure from shareholders can result in good short-term revenues but it can very easily backfire in the long-term, ultimately ruining the company’s efforts to grow.
Synergy
Overall, it is important to analyze the environment before deciding to diversify. Several companies decide to partner up in order to commonly utilize each other’s resources. The ultimate goal is to achieve the right synergy and thus drive growth. Sometimes, negative synergy can be more detrimental than no synergy at all. Meaning that sometimes it is better for different companies not to try complementing each-other.
There are cases, however, in which two businesses can result in negative synergy.
Such synergies result in value destruction rather than value-adding.
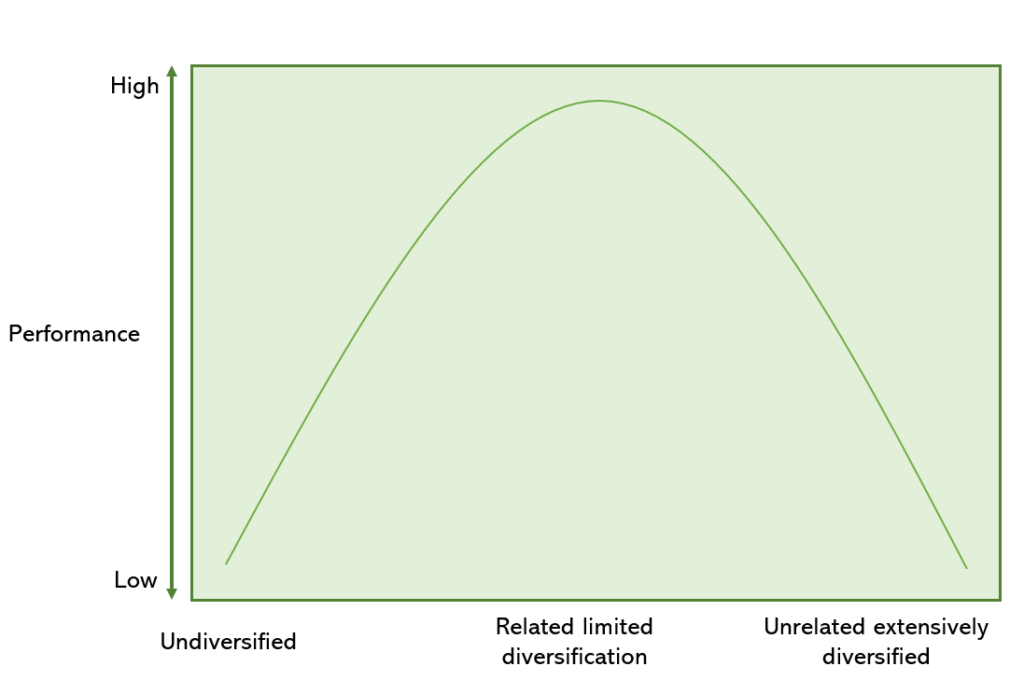
Diversification and Performance
Generally, diversification and performance follow an inverted U-shape graphical relation. What this means is that undiversified companies exhibit low performance. Companies that apply limited diversification (within related activities) exhibit a much higher performance. And ultimately, companies that diversify too much, and thus diversify in unrelated activities, have a much lower performance. Sometimes even lower than that of undiversified companies.
Related diversification – include activities that can be beyond the current products or markets of a company, but still remain within the capabilities of the company’s value network.
Some examples of related diversification would be vertical integration (backward integration or forward integration) or horizontal integration.
Unrelated diversification – you probably have guessed already that this covers the development of products and activities that are not part of, or manageable by the existing capabilities or value network.
As a general rule of thumb, a deep-level analysis has to be done before diversifying into different activities. Each individual diversification needs to be tested in terms of relatedness to the organization’s capabilities. Otherwise, it can be turn out to be more detrimental.

Conclusion
The Ansoff Matrix is probably one of the most widespread tools managers use in strategic planning for most organizations. It is easy to understand and allows decision-makers to visually represent the organization’s scope of work. In combination with other tools, such as the Ishikawa Fishbone diagram, it can efficiently help teams anticipate and calculate risk throughout the whole project management process.
Takeaways
- Igor Ansoff developed the Ansoff Matrix in 1957.
- It allows us to visualize growth possibilities.
- The Ansoff Matrix provides four different forms of growth – they differ in the amount of risk they carry:
- Market penetration
- Product development
- Market development
- Conglomerate diversification
- There are multiple drivers of diversification; it is important to diversify in activities related to the organization’s strategic capabilities and value network.
- Over diversifying across unrelated activities can greatly lower performance.
- The Ansoff Matrix is used to plan the company’s possible options and the respective risk it entails in order to address the most obvious uncertainties – ultimately it allows you to make the best decision for your corporation.
We hope to have covered most of the concepts related to the Ansoff Matrix. Now it’s time to use it to drive growth.
If you think we missed something or would like to know more regarding Ansoff Matrix and how to make organizational decisions for driving growth, let us know in the comments section below.
The results from the Ansoff Matrix give brands the answer to which model will work best for them and where they need to focus their resources.